Freelance iOS, macOS, Apple Watch, and Apple TV Developer
Web inspector on ios devices and simulators.
Want to keep up to date? Sign up to my free newsletter which will give you exclusive updates on all of my projects along with early access to future apps.
Over the past few weeks I’ve worked on a number of projects that have necessitated me working with HTML and JavaScript be that via Safari on iOS, an SFSafariViewController, or in an embedded WKWebView. In all of these cases, I’ve needed to dive into the DOM to see what styles are being applied to certain elements or dig into a JavaScript Console to work out why some code isn’t working. On desktop, this is trivial as Safari has a Web Inspector panel built in similar to other browsers. It turns out it is also trivial on mobile as the exact same tool can be used with both iOS simulators and physical devices.
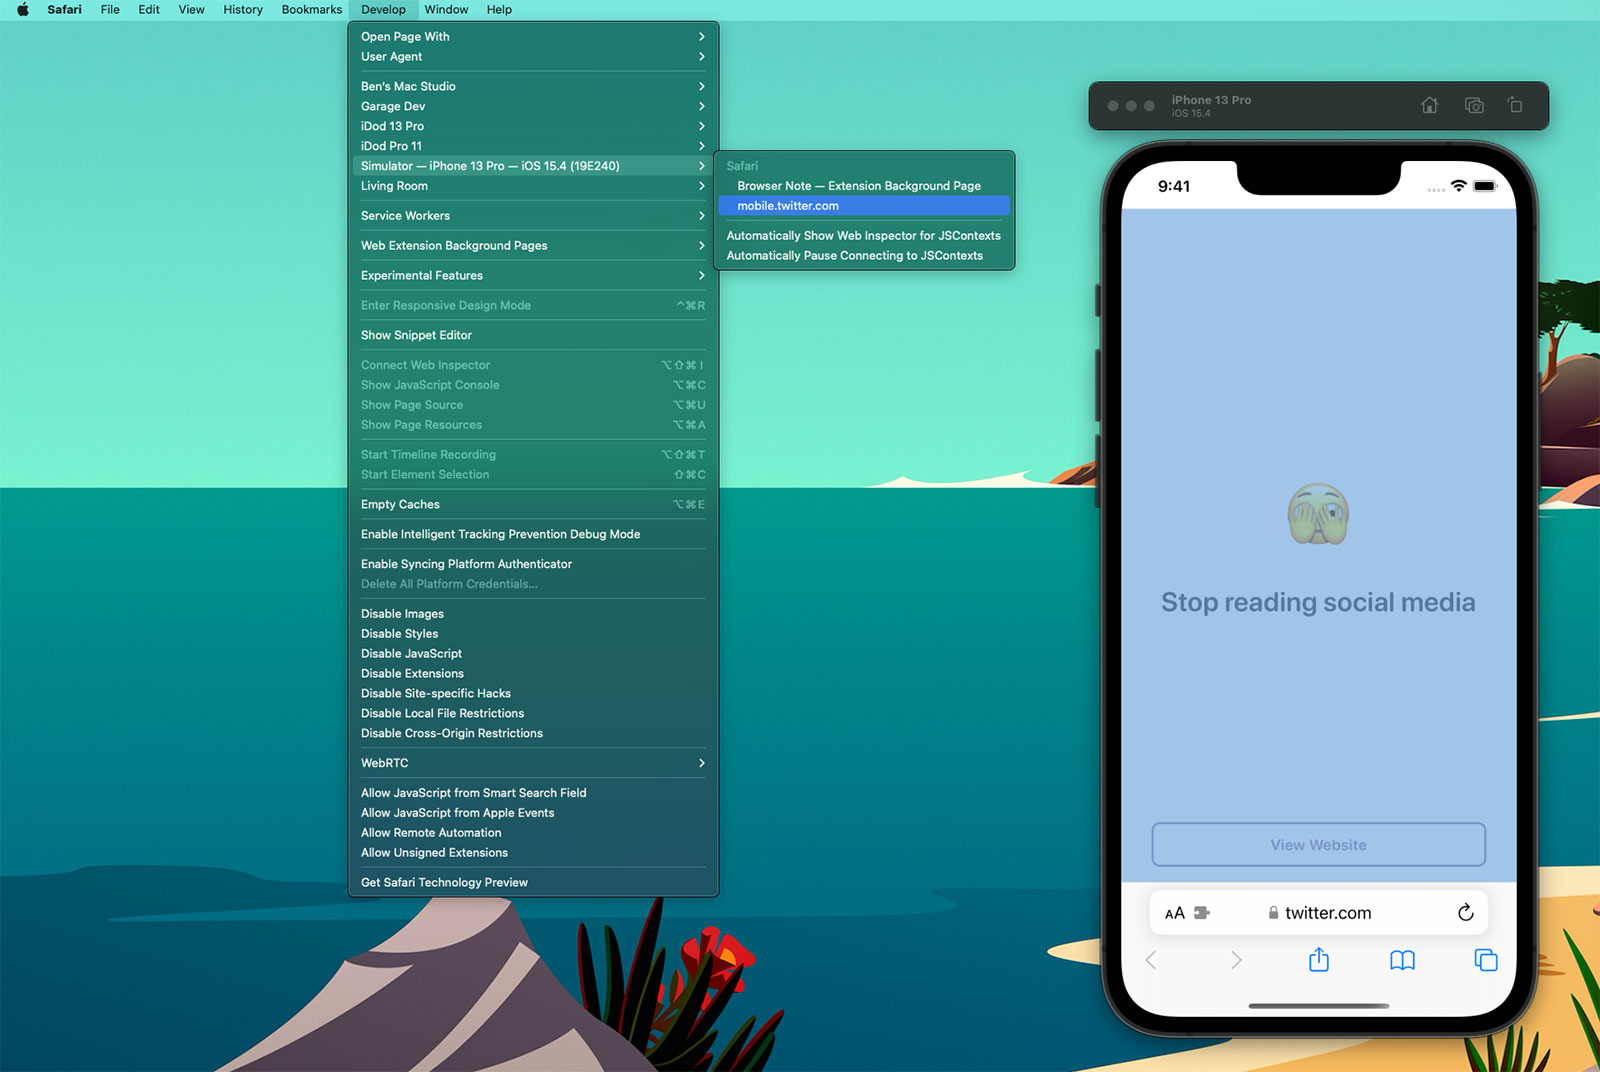
If you select the ‘Develop’ tab from the menu bar of Safari on macOS, you’ll see a list of all of your connected devices and actively running simulators 1 . Drilling into this will then show all of the active web instances you can interact with; notice how the content within Safari has highlighted blue within the Simulator as I’ve moused over the twitter.com web instance above. When you click, a web inspector panel is then produced which allows you to make all the usual interrogations and changes you can within desktop Safari such as interacting with the console or changing CSS values of elements to see how they would look in realtime.
Here’s an example using a WKWebView within one of my client projects, Yabla Spanish :
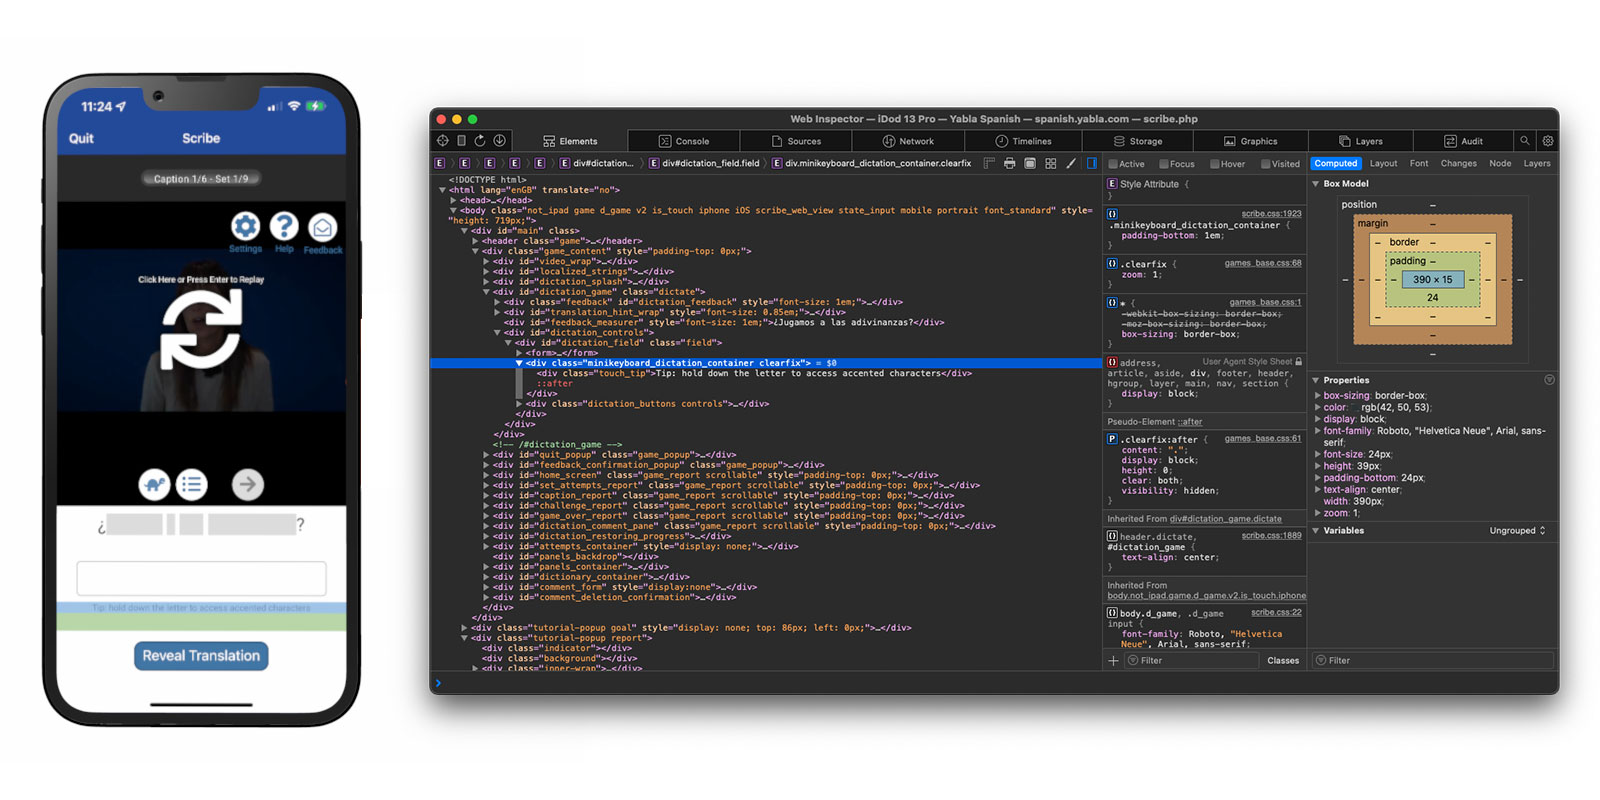
Discovering that simulators and devices could be interacted with in this way has been a huge timesaver for me. Whilst developing Browser Note , I was constantly needing to tweak CSS values and investigate the current state of the DOM as websites have various tricks to try and make ads or cookie notices appear on top of all content (and the note needed to be on top at all times - you should totally take a look at Browser Note whilst you’re here). In doing this, I was then able to put this knowledge to use on no less than 3 client projects in the past month; this validates my theory that by working on your own side projects you can improve your efficiency when it comes to work projects.
There are a few caveats to be aware of when using the Web Inspector with an iOS device or simulator:
- If you want to use this on an actual device you’ll first need to enable the Web Inspector on iOS. To do this, go to the Settings app and then Safari > Advanced and toggle the Web Inspector on.
- Whilst the Web Inspector can interrogate WKWebView, it can only do this for apps you are running via Xcode. You cannot look at the WKWebView of apps you did not create nor of your own apps from TestFlight / the App Store. However, you can inspect debug builds installed via Xcode even if the debugger is not active (i.e. you build to the device then quit Xcode).
- Conversely, you can use the Web Inspector with any SFSafariViewController even if it is not in your own app.
- Whilst it is still possible to submit apps that use UIWebView, the web inspector will not work with them; it needs to be WKWebView .
- This also works for AppKit, SwiftUI, and Catalyst apps on macOS.
I use an “iDod” naming prefix for all of my devices; a throwback pun to my first Apple product, the iPod. ↩︎
- Editor's Choice: Back-to-School Tech Gifts
- Get These 12 Student Discounts!

How to Activate the iPhone Debug Console or Web Inspector
Use Safari's web developer tools to study problematic websites
:max_bytes(150000):strip_icc():format(webp)/ScottOrgera-f7aca23cc84a4ea9a3f9e2ebd93bd690.jpg)
- Saint Mary-of-the-Woods College
- Switching from Android
What to Know
- Activate Web Inspector on iOS: Go to Settings > Safari > Advanced and move the Web Inspector toggle switch to the On position.
- Use Web Inspector on macOS: Connect your iOS device to a Mac and choose the URL to inspect from the Develop menu.
If you run into a bug or another issue with a website on Safari mobile, use the Web Inspector tool to investigate. This article explains how to use the Safari console for iPhone to debug errors with the help of your Mac computer. Instructions apply to iPhones with iOS 14, iOS 12, or iOS 11, and well as Macs with macOS Big Sur (11.0), macOS Catalina (10.15), or macOS Mojave (10.14).
Activate Web Inspector on Your iPhone or Other iOS Device
The Web Inspector is disabled by default since most iPhone users have no use for it. However, if you're a developer or you're curious, you can activate it in a few short steps. Here's how:
Open the iPhone Settings menu.
On an iPhone with an early version of iOS, access the Debug Console through Settings > Safari > Developer > Debug Console . When Safari on the iPhone detects CSS, HTML, and JavaScript errors, details of each display in the debugger.
Scroll down and tap Safari to open the screen that contains everything related to the Safari web browser on your iPhone, iPad, or iPod touch.
Scroll to the bottom of the page and select Advanced .
Move the Web Inspector toggle switch to the On position.
Connect Your iOS Device to Safari on a Mac
To use the Web Inspector, connect your iPhone or another iOS device to a Mac that has the Safari web browser and enable the Develop menu .
With Safari open, select Safari from the menu bar and choose Preferences .
Select the Advanced tab.
Select the Show Develop menu in menu bar check box and close the settings window.
From the Safari menu bar, select Develop and choose the name of your attached iOS device, then select the URL that appears under Safari to open the debug console for that site.
After you connect your device, use your Mac to inspect the website you want to debug and have it open in the Safari mobile browser.
What Is Web Inspector?
Web developers use Web Inspector to modify, debug, and optimize websites on Macs and iOS devices. With Web Inspector open, developers can inspect the resources on a web page. The Web Inspector window contains editable HTML and notes regarding the styles and layers of the web page in a separate panel.
Before iOS 6, the iPhone Safari web browser had a built-in Debug Console that developers used to find web page defects. Recent versions of iOS use Web Inspector instead.
With Safari 9 and OS X Mavericks (10.9), Apple introduced Responsive Design Mode in Web Inspector. Developers use this built-in simulator to preview how web pages scale to different screen sizes, resolutions, and orientations.
To set up Web Inspector on your iPad, open your iPad's Settings and select Safari > Advanced , then turn Web Inspector On . Connect the iPad to a Mac computer, then open Safari on the Mac and select Safari > Preferences > Advanced , then turn on Show Develop menu in menu bar .
You cannot just connect your iPhone to a Windows PC and start using Web Inspector through Chrome like you can with a Mac. Installing package manager software can provide you a sort of workaround, but it's not recommended unless you're familiar with the package management app you intend to use.
Get the Latest Tech News Delivered Every Day
- How to Screen Record on iPhone 13
- How to Turn Off Do Not Disturb on iPhone 14
- How to Use Voice Control on iPhone and iPod Touch
- How to Turn Off the Flashlight on an iPhone 12
- How to Turn Off SOS on an iPhone 15
- How to Set up and Use Focus Mode on iPhone and Apple Watch
- How to Fix Could Not Activate Cellular Data Network Error
- How to Activate Incognito Mode in Chrome for iPhone, iPad, and iPod Touch
- The 10 Best iPhone Hacks & Tips for 2024
- How to Fix it When Optimized Battery Charging is Not Working on iPhone 13
- How to Unlock iCloud-Locked iPhones
- How to Turn Off SOS on an iPhone 14
- Do These 12 Things First When You Get a New iPhone
- How to Get Your iPhone to Announce Calls
- iPhone Focus Mode: What It Is and How to Use It
- Where to Buy an iPhone

Debug iOS Safari with Xcode Simulator and Web Inspector
- Published: 15 Jun 2020
Uses: Xcode simulator
How I debug CSS for iOS Safari on my MacBook Pro.
If you're like me and don’t have an iOS device, you can use Xcode Simulator to view and debug mobile Safari from your Mac.
Why would you need to simulate mobile Safari? Phones in general don't even have web inspectors for debugging. Have you ever had a CSS quirk on an iPhone and no iPhone to test with? I have.
As a lifelong Android user and web designer by trade, I regularly need to preview, test, or fix things for iOS Safari. Thankfully my MacBook has a way to simulate iOS devices so that I can preview and debug mobile Safari! Likewise, it can simulate older and newer iOS versions if needed.
The following steps may vary for newer and older versions of macOS, Xcode, and Safari. This guide uses:
- MacBook Pro (Retina, 15-inch, Mid 2015)
- macOS Mojave version 10.14.6
- Xcode version 11.3.1
- Safari version 13.1.1
Step 1: Open Xcode and Launch Simulator
From your Applications, launch Xcode. (Optionally, update Xcode if it yells at you when you try to open it.)
Once Xcode opens, navigate to Open Developer Tool > Simulator from the Mac toolbar.
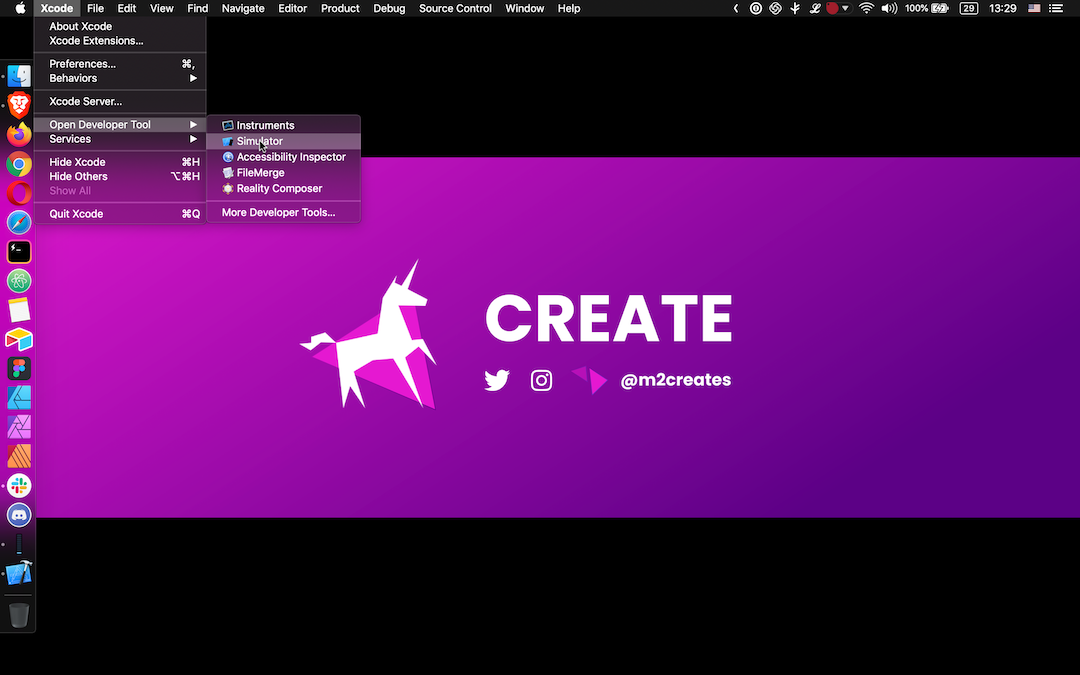
If you’re a Spotlight user (which I am not), just search for Simulator and bypass launching Xcode altogether.
Step 2: Adjust the Simulator
A simulated device should pop up on your screen and begin loading. From the Mac toolbar, you can adjust the simulator via Hardware > Devices and select the OS and Device. You can pick from various iPhones and iPads in the iOS dropdown.
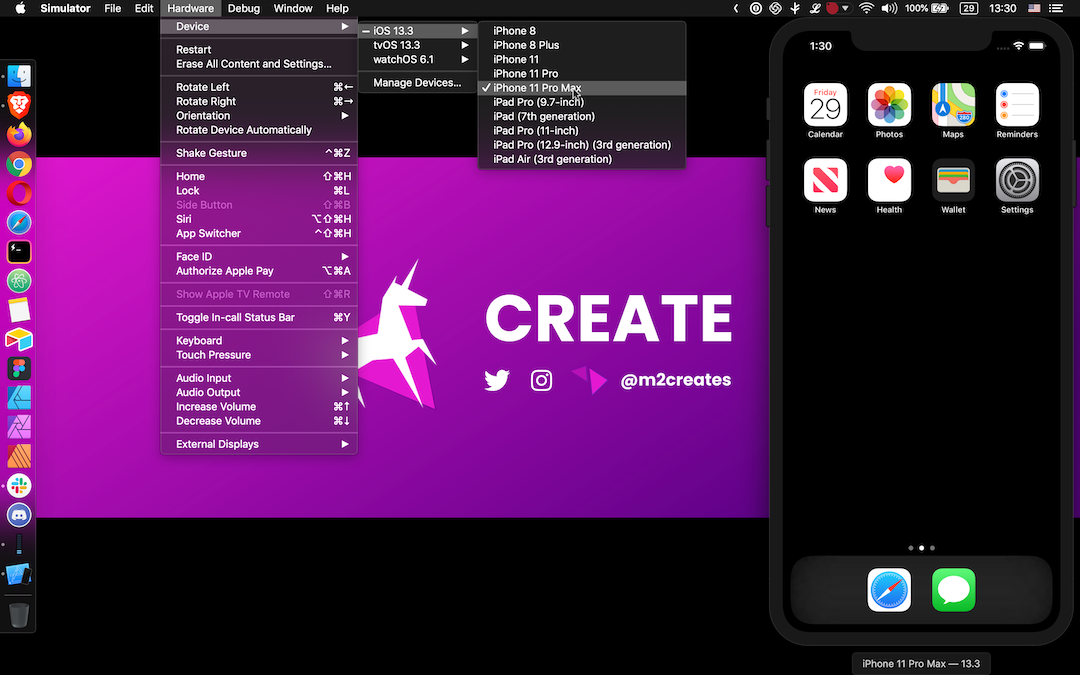
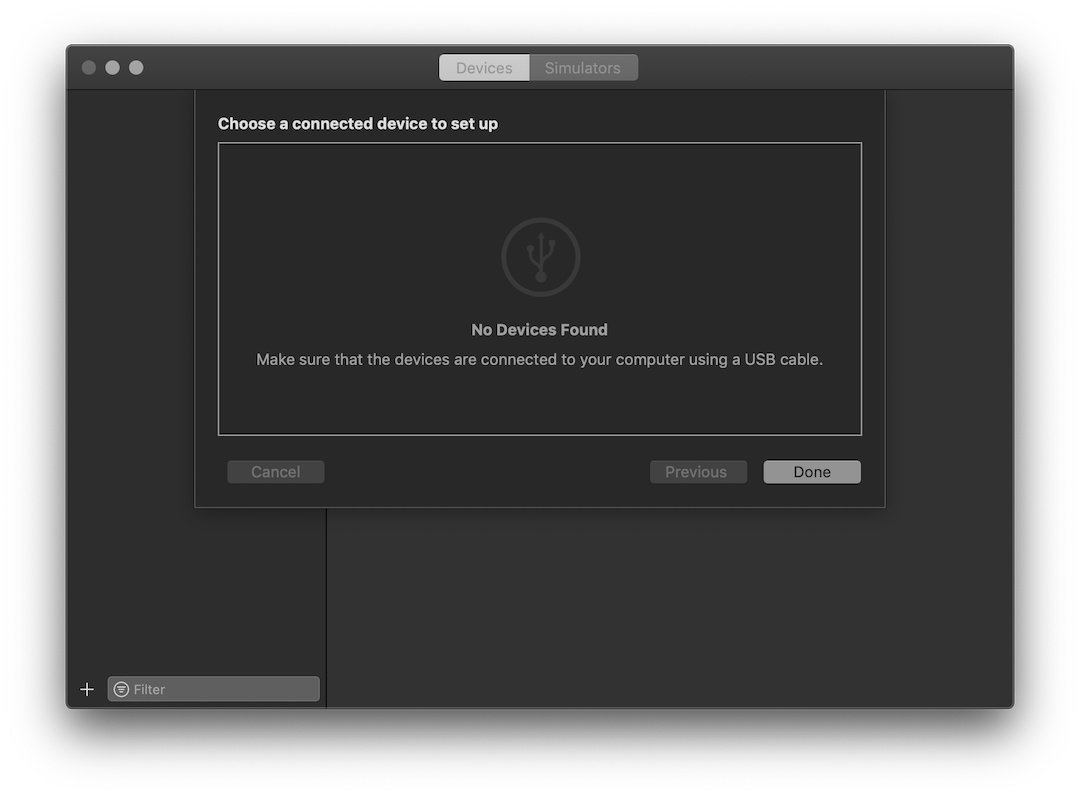
If you need something different, select Manage Devices for a suite of additional options:
Under Devices, add a device connected through USB.
Under Simulators, add a new simulator by selecting a device and iOS version (or install an additional iOS version runtime).
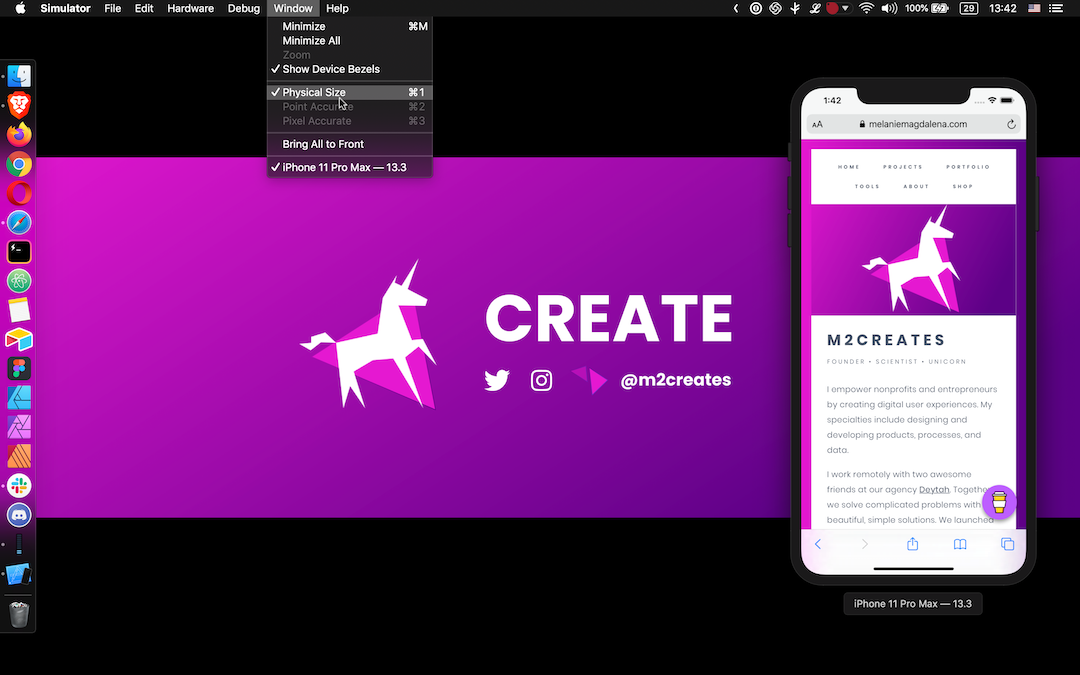
You can choose to use the simulation at the actual device size (instead of your screen's full height). Assign it via the Mac toolbar under Window to Physical Size.
Step 3: Simulate iOS Safari
In the Simulator, open up mobile Safari. Navigate to the appropriate page you’d like to interact with via Safari Web Inspector.
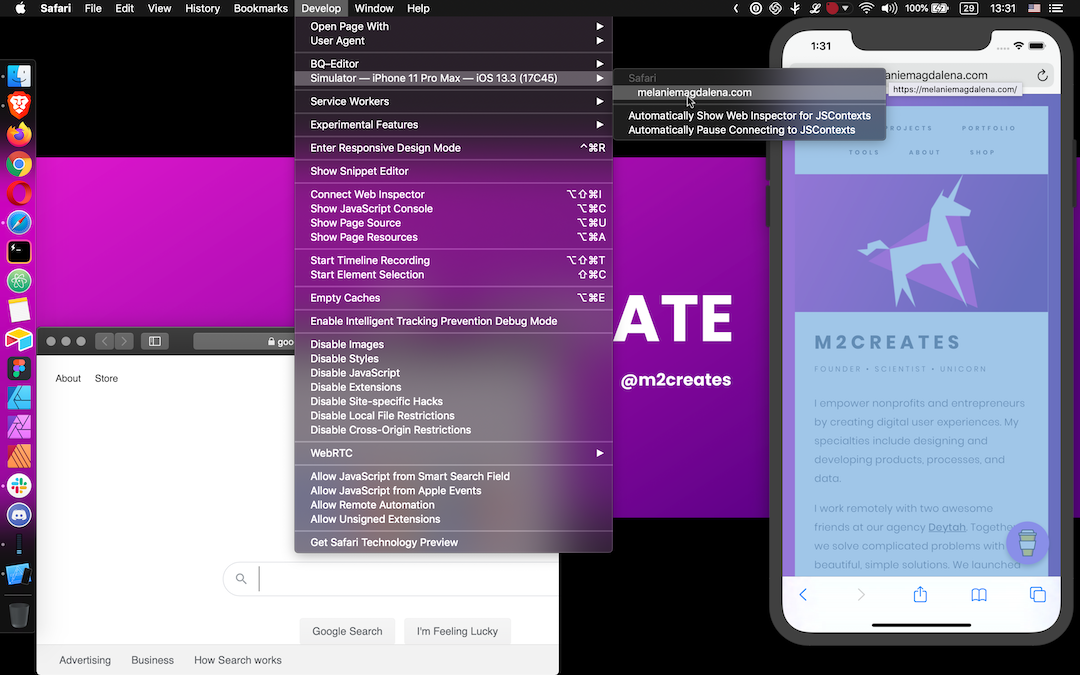
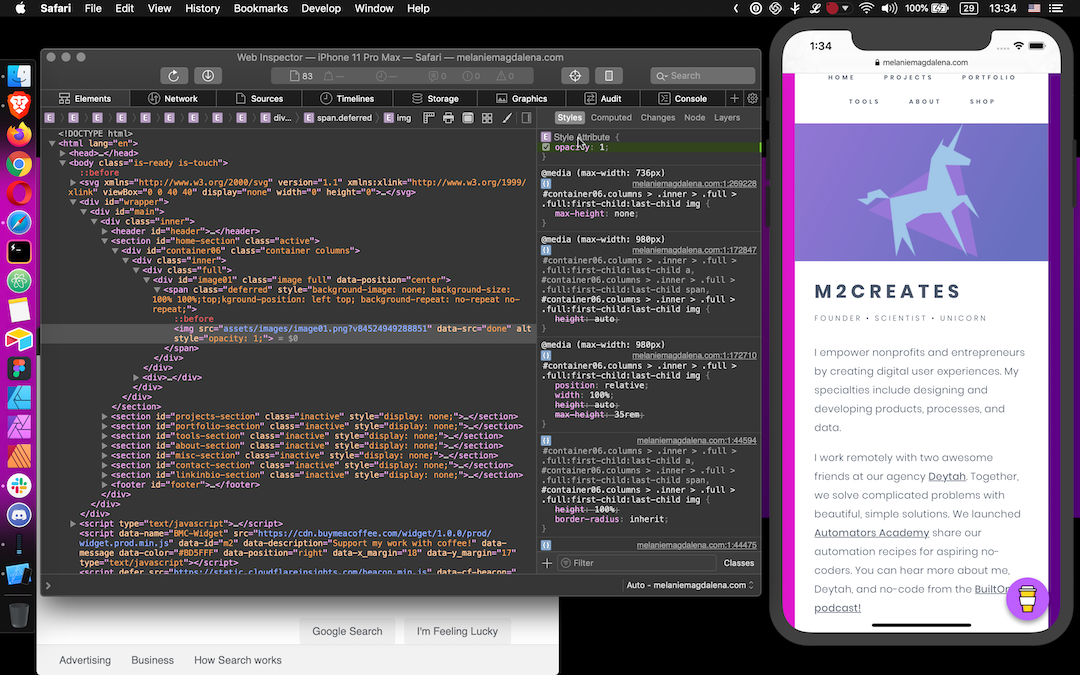
On your Mac, open up Safari. In the Mac toolbar under Develop , select the Simulator option beneath your device’s name. Pick the iOS Safari tab loaded in the Simulator. Web Inspector will launch to start debugging mobile Safari!

Step 4: Use Web Inspector to Debug Mobile Safari
Now you can go about your business and hopefully resolve whatever brought you down this rabbit hole to begin with. Debug mobile Safari just like you normally would for desktop Safari.
Additional Resources
Need more help?
- Visit Apple's Simulator Help
- Visit Apple's Safari Developer Help
Other guides that may be helpful:
- Debugging Your iPhone Mobile Web App With Safari Dev Tools by Matthew Croak on Medium [Premium Article]
- How to Use Web Inspector to Debug Mobile Safari (iPhone or iPad) by SK on Apple Toolbox
Simulator Bonuses
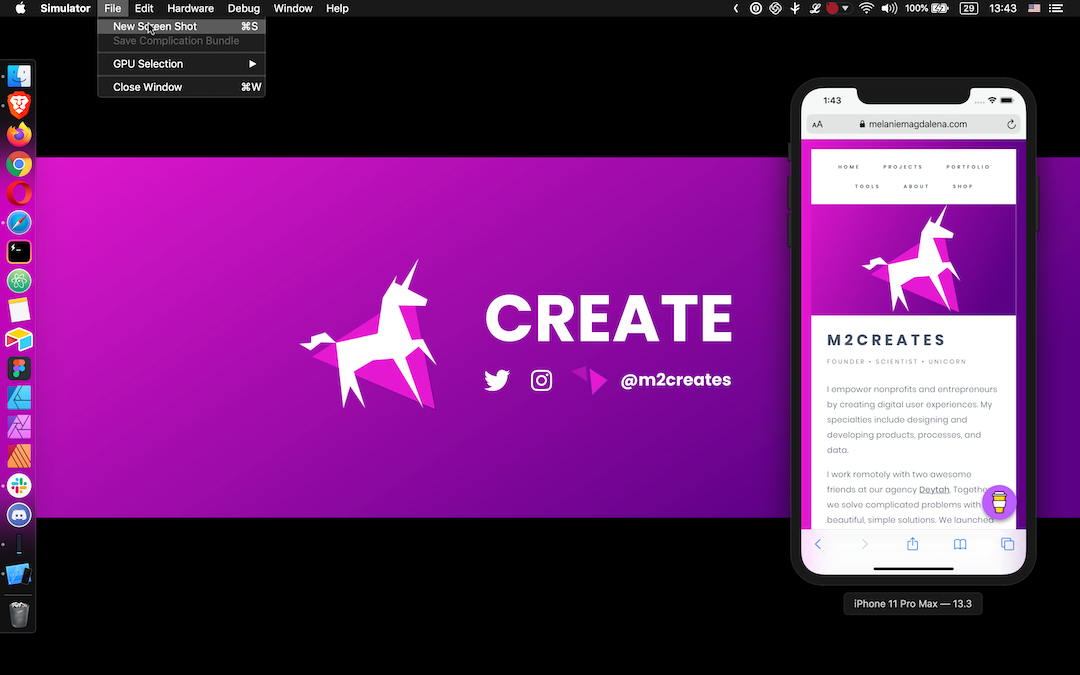
In the Simulator, from the Mac toolbar under File you can take a New Screen Shot , or use CMD+S.
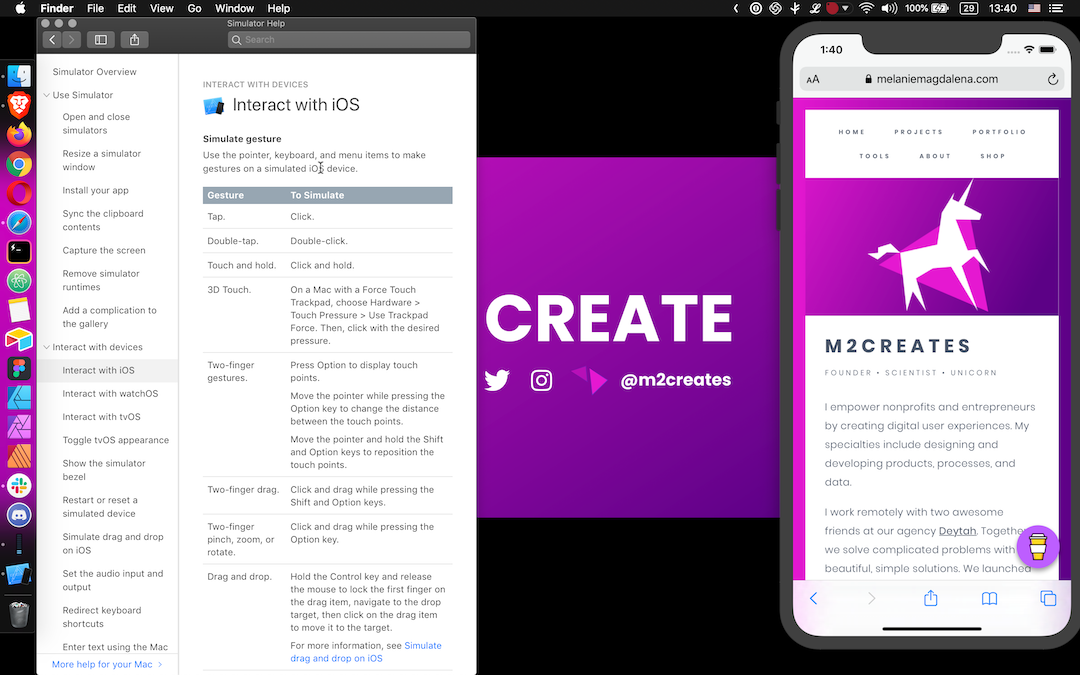
For a how-to on more features and functionality offered in the Simulator, browse the Help section. I kind of want a Force Touch track pad now...
- Written by Melanie E Magdalena
Tags: # debugging
Thanks for reading! If this helped or you learned something, Buy Me A Coffee.
- Documentation
Get Started
- Introduction to Inspect
- Installation guide
- Using Inspect
- How to debug mobile websites on iOS devices with Inspect
- How to debug WebViews on iOS devices with Inspect
- Wireless debugging over WiFi
iOS Simulator debugging
- How to debug mobile websites on Android devices with Inspect
- Managing teams and organizations

Troubleshooting
- Devices and targets
- Issues and bugs
Alternatives
- What makes Inspect a great alternative to ios-webkit-debug-proxy
- What makes Inspect a great alternative to remotedebug-ios-webkit-adapter?
How to debug Safari and WebViews running within the iOS Simulator with Inspect
Inspect can connect to your your iOS Simulator running locally on your Mac, so you can debug and inspect Safari and other targets without connecting a physical device.
How to enable iOS Simulator debugging
Install XCode and install the iOS Simulator. See https://developer.apple.com/documentation/xcode/installing-additional-simulator-runtimes
Install the XCode Commandline Tools. See https://mac.install.guide/commandlinetools/
Make sure xcrun simctl is installed and available in your $PATH . You can validate this by running
Open Inspect.
Your iOS Simulator and its debuggable targets should now show up.
Happy Inspecting! 🎉
iOS Simulator FAQ
inspect can’t find my ios simulator on macos, what do to.
Inspect uses the simctl utility provided by Xcode to detect and interact with iOS simulators. Follow these guides to make sure simctl works correctly:
- https://nshipster.com/simctl/
- https://medium.com/xcblog/simctl-control-ios-simulators-from-command-line-78b9006a20dc
Was this page helpful?
- How to enable iOS Simulator debugging
- iOS Simulator FAQ
- Inspect can’t find my iOS Simulator on MacOS, what do to?
Web Inspector Reference Enabling Web Inspector
Ios simulator.
To enable Web Inspector in Safari (or Safari Technology Preview ):
- click the Safari (or Safari Technology Preview ) menu bar item
- select Preferences… (or press ⌘ , )
- go to the Advanced pane
- check the Show Develop menu in menu bar checkbox
Show Web Inspector (or pressing ⌥ ⌘ I ) in the Develop menu or by right-clicking on any page in Safari (or Safari Technology Preview ) and selecting Inspect Element .
Once Web Inspector is enabled, the name of the current the macOS machine will appear as a submenu in the Develop menu of Safari (or Safari Technology Preview ), allowing for inspection of:
To enable remote inspection on an iOS device:
- open the Settings app
- go to Safari
- scroll down to Advanced
- enable the Web Inspector toggle
Once Web Inspector is enabled, connecting the iOS device to any macOS machine, either via a physical cable or after configuring wireless debugging in Xcode , the name of the iOS device will appear as a submenu in the Develop menu of Safari (and Safari Technology Preview ) on the connected macOS machine, allowing for remote inspection of:
- any page in Safari
- websites added to the home screen
- SFSafariViewController
NOTE : in order to use remote inspection, Web Inspector must be enabled on the connected macOS machine.
Remote inspection is always enabled for iOS simulators, meaning they will also appear in the Develop menu of Safari (and Safari Technology Preview ) just like connected iOS devices.
Automatic Inspection
At the bottom of any macOS machine or iOS device submenu in the Develop menu of Safari (or Safari Technology Preview ), there are two toggles:
- Automatically Show Web Inspector for JSContexts controls whether Web Inspector is automatically opened whenever a JSContext is created by any inspectable application on the corresponding macOS machine or iOS device.
- Automatically Pause Connecting to JSContexts controls whether Web Inspector automatically pauses JavaScript execution when inspecting any JSContext on the corresponding macOS machine or iOS device.

Written June 8, 2020 by Brian Burg , Devin Rousso , Joseph Pecoraro , and Timothy Hatcher
Last updated September 8, 2020 by Devin Rousso
How to Debug Safari Issues on iOS Using Xcode
Ever tried opening a website on an iPhone and noticed it looks or behaves differently? This can happen because of the way Safari on iPhones (or iOS) works. If you’re making websites or web apps, you’ll want them to work perfectly on iPhones too. This guide will show you how to spot and fix these issues using a tool called Xcode.
1. Essential Tools to Debug Safari Issues on iOS Using Xcode :
- Xcode : Ensure you have the latest version installed. It’s available on the Mac App Store.
- iOS Device or Simulator : You can either use an actual device or the built-in simulator that comes with Xcode.
- Developer Account : If using a physical device, ensure it’s registered on your Apple Developer account.
2. Setting up the Simulator :
- Launch Xcode and initiate the iOS Simulator of your choice.
- Once running, navigate to the Safari app, similar to how you’d do on a physical device.
3. Setting up Web Inspector on Mac :
- Initiate Safari : Open Safari on your Mac. Ensure you’re using Safari and not another browser.
- Access Preferences : Navigate to Safari -> Preferences -> Advanced .
- Enable Develop Menu : Check the box labeled “Show Develop menu in menu bar.”
- Access Webpages : In Safari’s menu bar, click on Develop . Under this, you’ll see your simulator or connected device listed. Hovering over the device’s name will display a list of open webpages. Click on the page you’d like to inspect.
4. Dive into Debugging :
- The Web Inspector, quite similar to developer tools in other browsers, allows you to inspect elements, check console logs, monitor network activity, and more.
- Replicate your issue in Safari (either on the simulator or device) and utilize the Web Inspector to gather insights and debug.
5. Key Features of Web Inspector :
- Console Logs : Vital for capturing errors or important logs.
- Network Requests : Monitor requests to ensure all assets load correctly and to track any API issues.
In Conclusion :
Debugging can sometimes be a daunting task, especially when the issue is platform-specific. However, with the right tools and a systematic approach, you can effectively identify and resolve problems in Safari on iOS. Always ensure you’re using the latest versions of Xcode and Safari, as updates often contain crucial bug fixes and improvements.
Happy debugging!
iOS 16.4 webview can not debug in safari web inspector
version: iOS 16.4(20E5239a) both on my iphone and Simulator,Safari -> develop shows "no inspectable applications"
Also seeing this since upgrading to Xcode 16.4. Previously, it was working.
Made the careless mistake of updating to iOS 16.4, and now our Capacitor application doesn't appear in Safari debug. I hope this gets solved quickly!
Are you using this to debug webpages or for webviews in an app?
Apparently this is by design now with iOS 16.4. You need to actually mark the webview as inspectable even while running in debug mode from Xcode. See blog post at https://webkit.org/blog/13936/enabling-the-inspection-of-web-content-in-apps/
If you're on Capacitor, there are more details and a temporary workaround here: https://github.com/ionic-team/capacitor/issues/6441
Installing Safari Technology Preview 16.4 on the mac to access the console from an iPhone with safari 16.4 make the console log available again. Thank you thmclellan :)
Installing Safari Technology Preview 16.4 on the mac DID NOT help me..
Cordova team fix this bug with the release of Cordova platform iOS 6.3.0 (see Cordova blog post: https://cordova.apache.org/announcements/2023/04/15/cordova-ios-release-6.3.0.html )
If you cant update your Cordova iOS platform for any reasons, you can update yourself the CordovaLib/Classes/Private/Plugins/CDVWebViewEngine/CDVWebViewEngine.m file. Open your project in Xcode, go to the CDVWebViewEngine.m file, search for the lines:
Then add following line and save. Re build your project and it should works (solution found here)
I also recommend using Safari Technology Preview instead of Safari for debugging with web inspector. Good luck.
Solution by @iwantosee its works for me, and with Safari Technology preview it works. Thank you so much for your Answer.

IMAGES
COMMENTS
There are a few caveats to be aware of when using the Web Inspector with an iOS device or simulator: If you want to use this on an actual device you'll first need to enable the Web Inspector on iOS. To do this, go to the Settings app and then Safari > Advanced and toggle the Web Inspector on. Whilst the Web Inspector can interrogate WKWebView ...
In the Settings dialog, go to the Advanced tab, and enable Show features for web developers : This will enable a menu item called Develop in the Safari menu bar: Quit Safari, and then restart it. Open the Developer Tools of the simluator. To do this, assuming you have your Xcode simulator already open, click on the Develop menu item in Safari.
Web Inspector is always enabled for simulators, and currently booted simulators will appear in the Develop menu just like connected devices. Inspecting a webpage. Webpages you open in Safari in iOS and iPadOS appear in a submenu for the connected device of the Develop menu of Safari on a connected Mac. Safari groups webpages and other content ...
Activate Web Inspector on iOS: Go to Settings > Safari > Advanced and move the Web Inspector toggle switch to the On position. Use Web Inspector on macOS: Connect your iOS device to a Mac and choose the URL to inspect from the Develop menu. If you run into a bug or another issue with a website on Safari mobile, use the Web Inspector tool to ...
Participants 6. I just installed Xcode 9.3.2-Beta and I am unable to find the Web Inspector in Simulator Settings -> Safari -> Advanced. Do you know if this feature is not yet implemented? When I am connecting an iPhone with an application I am able to see in Safari the phone. I click "use for development", then I can see the inspector.
Overview. Web Inspector helps you inspect all the resources and activity on webpages, Service Workers, Mac and Home Screen web apps, and JavaScript running inside your applications, making development more efficient across Apple platforms. The clean, unified design puts each core function in a separate tab, which you can rearrange to fit your ...
Step 3: Simulate iOS Safari. In the Simulator, open up mobile Safari. Navigate to the appropriate page you'd like to interact with via Safari Web Inspector. On your Mac, open up Safari. In the Mac toolbar under Develop, select the Simulator option beneath your device's name. Pick the iOS Safari tab loaded in the Simulator.
Enable Web Inspector on iOS : Open the Settings app on your iPhone or iPad. Scroll down and tap Safari. Scroll to the bottom of the page and tap Advanced. Tap the toggle next to Web Inspector to the On position. Enable Safari Developer Mode on Mac : Open Safari on your Mac. Click Safari in the top left corner of your Menu Bar.
How to debug Safari and WebViews running within the iOS Simulator with Inspect Inspect can connect to your your iOS Simulator running locally on your Mac, so you can debug and inspect Safari and other targets without connecting a physical device.
Get ready to explore Safari's rich set of tools for web developers and designers. Learn how you can inspect web content, find out about Responsive Design Mode and WebDriver, and get started with simulators and devices. We'll also show you how to pair with Vision Pro, make content inspectable in your apps, and use Open with Simulator in ...
iOS Simulator. Remote inspection is always enabled for iOS simulators, meaning they will also appear in the Develop menu of Safari (and Safari Technology Preview) just like connected iOS devices. Automatic Inspection. At the bottom of any macOS machine or iOS device submenu in the Develop menu of Safari (or Safari Technology Preview), there are ...
Step 1: Device Side Settings (iPhone/ iPad / Simulator) : First, we need to enable Web Inspector on Safari. Navigating to Settings > Safari > Advanced, and toggling the Web Inspector option on.
Jun '20. Accepted Answer. Hello Mateo, You can emulate many iOS devices and runtimes using the Simulator included with Xcode, and remotely debug/inspect those webviews using Safari's Develop menu. You can test out responsive layouts using Safari's Responsive Design Mode tool, under the Develop menu. This is also compatible with Web Inspector.
Also, Safari 6 is only available for Macs running OSX Lion or higher. Methods for Using Web Inspector. There are two methods for using web inspector in mobile Safari: Real Device Method: Use a real iDevice (iPhone, iPad, etc) connected to your computer via USB; Virtual Device Method: Use the iOS simulator, which is part of Xcode
Enabling Inspection. Across all platforms supporting WKWebView or JSContext, a new property is available called isInspectable ( inspectable in Objective-C). It defaults to false, and you can set it to true to opt-in to content being inspectable. This decision is made for each individual WKWebView and JSContext to prevent unintentionally making ...
I'm having the same problem since upgrading to macOS Sierra and XCode 8.1. The Simulator starts the program, but Safari's Develop menu doesn't show the Simulator device. Web Inspector is turned on in Settings->Safari->Advanced on the simulated device, but that doesn't help. I tried reseting everything, and still no luck.
Launch Xcode and initiate the iOS Simulator of your choice. Once running, navigate to the Safari app, similar to how you'd do on a physical device. 3. Setting up Web Inspector on Mac: Initiate Safari: Open Safari on your Mac. Ensure you're using Safari and not another browser. Access Preferences: Navigate to Safari -> Preferences -> Advanced.
After Web Inspector is enabled, connect your device to your desktop machine with a USB cable. The name of your device appears in the Develop menu of Safari. Alternately, you can use iOS Simulator to take advantage of Web Inspector's debugging capabilities, which comes free with Xcode from the Mac App Store.
4. I had the same issue here, and i tried: make sure the simulator setting-safari-advanced-web inspector opened. reboot the simulator. if the simulator still not exist the menu, relaunch safari. may be you can just try the 3rd step, the simulator came back after step 3. answered Nov 9, 2016 at 7:14.
Open your project in Xcode, go to the CDVWebViewEngine.m file, search for the lines: Then add following line and save. Re build your project and it should works (solution found here) I also recommend using Safari Technology Preview instead of Safari for debugging with web inspector. Good luck.
Safari Web Inspectorでパフォーマンスが遅くなる原因 [3] [4] [13] :Safari Web Inspectorのパフォーマンスが低下する原因としては、大量のログメッセージが蓄積されている場合や、同時に多くのタブを開いている場合が考えられる。不要なタブを閉じたり、ログ情報を ...
The information provided by the inspector supplements accessibility testing by providing some of the raw information you need to debug accessibility issues. To use Accessibility Inspector, open Xcode and choose Xcode > Open Developer Tool > Accessibility Inspector. Focus on your app with Accessibility Inspector and investigate potential issues ...